Five charts explaining why inflation is at a 40-year high
Posted on AllSides January 12th, 2022
From The Left
ANALYSIS
The bumpy economic recovery has had policymakers, economists and Americans households grappling with greater price hikes for groceries, cars, rent and other essentials.
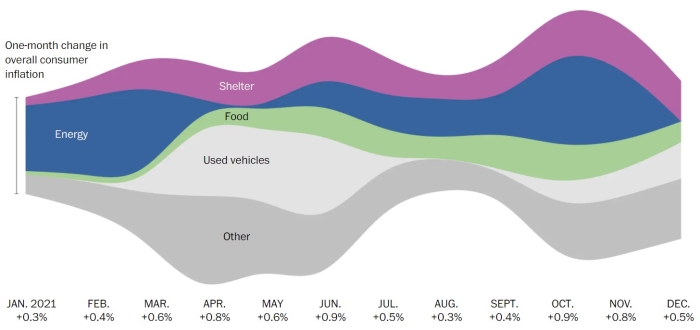
The latest inflation data, released by the Bureau of Labor Statistics, showed prices in December rose to a 40-year high, climbing 7.0 percent compared with the year before.
For months, officials at the Federal Reserve and White House argued that pandemic-era inflation will be temporary. But they’ve had to back away from that message, which was increasingly hard to square with what was happening in the economy — and the...
Some content from this outlet may be limited or behind a paywall.