
This data analysis was originally posted on ActiVote.net (not rated).
In June 2023, AllSides, CommonSense American and ActiVote collaborated on an Immigration Survey with 10 questions, each with 5 possible answers and 1 historic immigration bill with a yes/unsure/no vote. The poll was processed using ActiVote’s standard polling methodology. The average sample size was 1042 per question, leading to an expected polling error of about 3%. We invite you to participate in this survey if you have not already.
For each of the questions we have looked at the overall opinion of all survey takers as well as the split by party, especially focused on what Democrats think and what Republicans think to see whether there is consensus.
On some topics consensus is hard to find:
- Democrats would like to increase overall levels of immigration, while Republicans would like to reduce it.
- Democrats would like to focus on filtering out criminals at the border, while Republicans would like to strengthen border security and/or build a wall.
- Democrats would like to invest in the Northern Triangle, while Republicans don’t.
- Democrats in majority would like an amnesty program for some or all undocumented migrants while Republicans in majority believe they should leave or be deported.
- Democrats in large majority believe that asylum seekers waiting for a decision should be able to get to work (fast), while Republicans are reluctant to allow this.
But on others, there seems sufficient consensus to get something done:
- Both Democrats and Republicans would like to make employment based immigration easier.
- Democrats in large majority would like to extend the H2 Visa program, while more Republicans are for than against such a change.
- Democrats would like to help most if not all Dreamers. Republicans are very much split on the issue, suggesting that there might be a majority in both parties to help at least a subset of Dreamers.
- Both Democrats and Republicans believe that we should significantly increase the number of immigration judges.
- Democrats in large majority would like to increase the processing capacity of asylum seekers, while half of Republicans agree while the other half would like to reject asylum seekers faster.
And ultimately, a compromise bill like the 2013 “Border Security, Economic Opportunity and Immigration Modernization Act” could count on large bipartisan support.
In the next 11 sections we present the summary results per individual topic.
Levels of Immigration
The survey (answered by 1090 people) asked: “Which of these statements best reflects your opinion on the ideal levels of immigration to the United States?” and provided 5 answers:
- We should allow many more immigrants to come to the US (at least 3x the current levels).
- We should allow more immigrants to come to the US than today.
- The current levels are about right.
- We should significantly restrict immigration to the US.
- We should ban most or all immigration to the US.
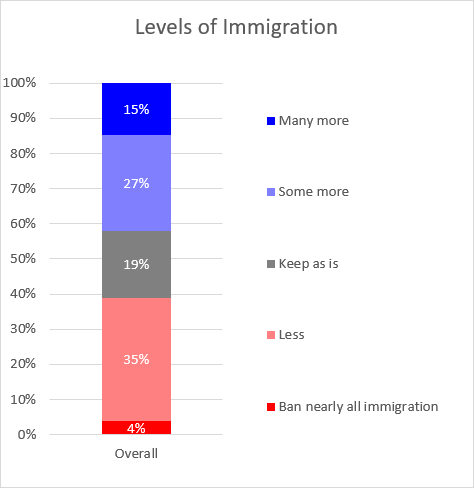
The country seems divided on this question. While almost no-one (4%) wishes to ban all immigration, 39% wish to reduce or ban it, while 42% wish to increase it.

There is a significant partisan divide on this topic: 60% of Democrats wish to increase immigration levels, while only 20% of Republicans agree. On the other hand, 63% of Republicans wish to reduce immigration, while only 21% of Democrats agree.
US Southern Border
The survey (answered by 1169 people) asked: “Which of these statements best reflects your opinion on border security on the US Southern border?” and provided 5 answers:
- We should not have security along the border, instead welcoming all immigrants who want to be here with open arms.
- We should focus our attention only on filtering out immigrants with a criminal background and welcome everyone else in.
- We should continue with the immigration policies of the last decade, which have already resulted in a significant reduction in illegal crossing.
- We should drastically increase border security, which could include additional physical barriers at select places along the border.
- We should build a physical barrier across the full southern border.
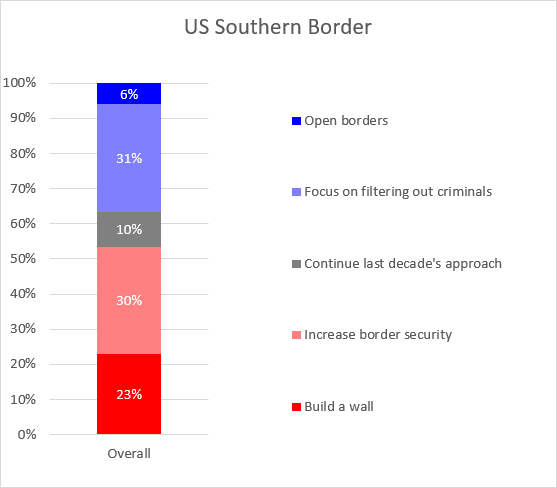
A majority (53%) believes that we should increase border security, possibly including building a wall across the full southern border. A minority of 37% believes that we should be more welcoming to non-criminals or even letting anyone in, although only 6% support open borders.
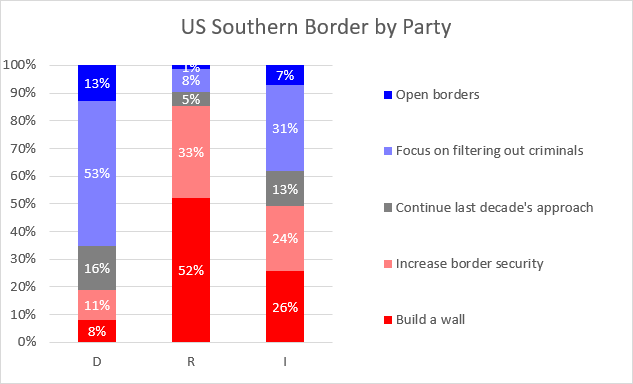
On this topic, Democrats and Republicans do not agree at all: 66% of Democrats wish to reduce security along the border and only 19% wish to increase it, while 85% of Republicans wish to increase security with a 52% majority wishing to “Build the wall”. Only 9% of Republicans believe that we should reduce border security.
Northern Triangle
The survey (answered by 975 people) asked: “Which of these statements best reflects your views on what the US should do related to the Northern Triangle?” and provided 5 answers:
- The US should continue deporting illegal immigrants from these countries, stop granting asylum to people from the region, cut aid and improve security at the Southern Border.
- The US should continue support of the United Nations and other international coalitions aimed at improving life in the region, but not take any unilateral action.
- The US should solely focus on reducing government corruption in the region.
- The US should continue sending aid and invest in this region while working closely with the governments to battle corruption and improve their economy.
- The US should actively intervene in the region to help the local governments bring peace and prosperity to the people.
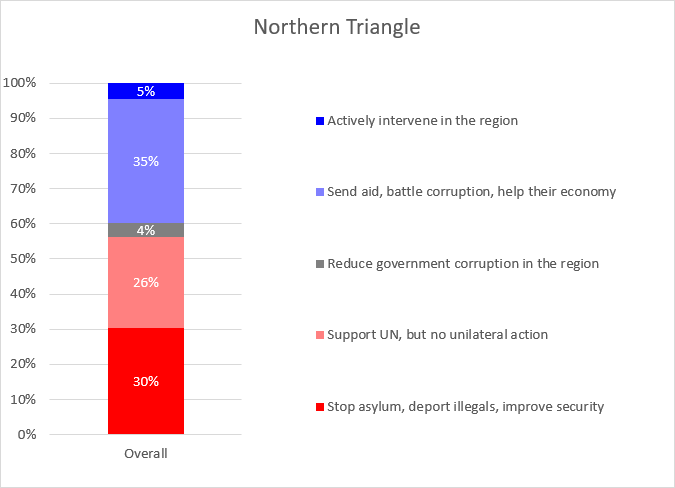
About ⅓ of respondents wish to stop asylum, deport illegals and improve security, ⅓ wish to have a hands-off approach, but support the UN, and ⅓ wish to send aid, battle corruption and help their economy. Thus, the country seems very much split on this topic.

There is a significant partisan split on this topic: Democrats in majority favor helping the region (60%) including active intervention, 23% would support the UN and only 13% wish to stop asylum, deport illegals and improve security. Republicans in majority (59%) choose the latter option, while only 14% would support the UN and another 22% support more active measures.
Employment Based Immigration
The survey (answered by 911 people) asked: “Which of the following statements best reflects your opinion on temporary work visas?" and provided 5 possible answers:
- H1B visas should have an easy pathway to permanent resident status just like EB visas.
- H1B visas should be renewable without requiring immigrants to leave the U.S. for a year.
- The current system should remain.
- Immigrants should not be able to reapply for H1B visas after they expire.
- All employment-based immigration should be temporary.

A large majority of 77% believes that employment based immigration should be made easier, either by providing an easy pathway to a green card, or by at least making the visa renewable from within the US. Only a small minority of 17% wants to make the current system more restrictive.
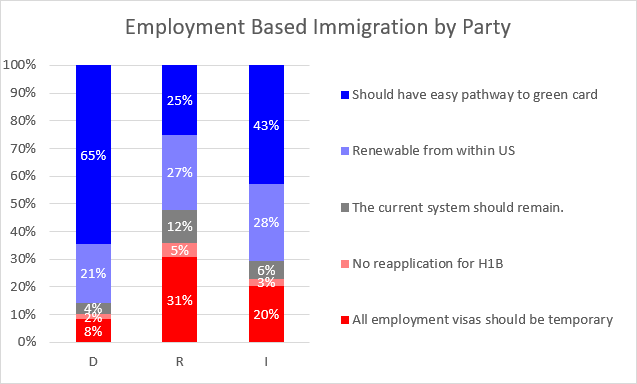
While Democrats are more supportive of making employment based immigration easier (86% support making it easier, vs. 10% wanting to restrict it), Republicans also clearly support making it easier: 52% vs. 36% who wish to restrict it more.
H2 Visa Program
The survey (answered by 1064 people) asked: “Which of the following statements best reflects your opinion on the H2 visa program?” and provided 5 possible answers:
- There should be no cap on H2 visas and it should be easier to get a visa granted.
- There should be no cap on H2 visas, but current rules and regulations for granting visas should remain.
- The current system is fine.
- The program should be made more strict leading to fewer visas granted per year.
- The program should be eliminated.

There is a significant majority (62%) for expanding the program, while only 27% believe the program should be reduced or eliminated.
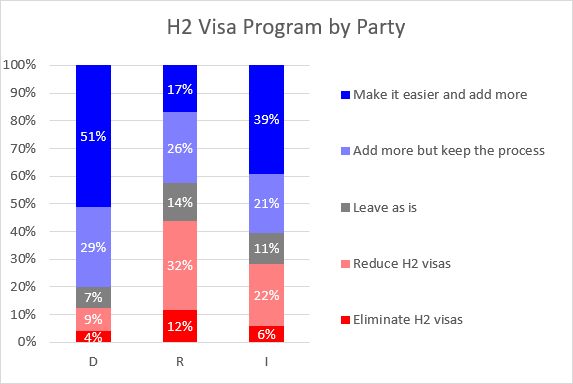
Democrats overwhelmingly support extending the H2 Visa program (80% vs. 13%), while half of Republicans are somewhat supportive (43%) but the other half (44%) wishes to restrict or eliminate the H2 visa program.
Deferred Action for Childhood Arrivals
The survey (answered by 1223 people) asked: “Which of the following statements best reflects your opinion about DACA and “DREAMers?” and provided 5 possible answers:
- All 1.7 Million “DREAMers”should be given permanent legal status and a pathway to Citizenship.
- DACA should be kept in place for its approximately 800,000 current recipients (but not allowing new sign-ups) until Congress passes comprehensive immigration reform.
- The courts should decide whether or not DACA is constitutional.
- DACA should be rescinded.
- All 1.7 Million “DREAMers” are here illegally and should return to their country of citizenship.
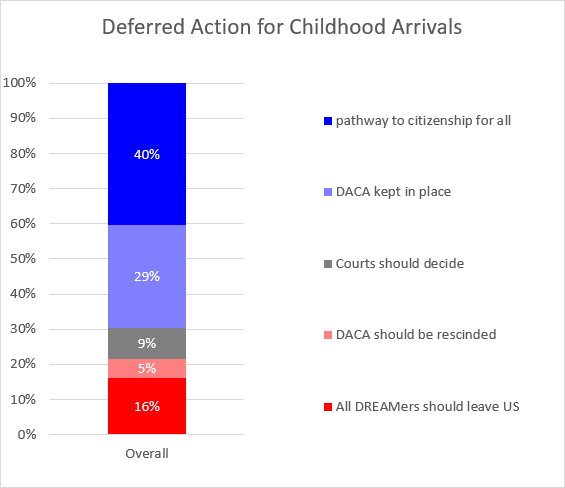
A significant majority (69%) believes that Dreamers should be able to stay in the US, either with a pathway to citizenship or by keeping DACA in place. Only 21% believe that DACA should be ended and/or that DREAMers should leave the US.
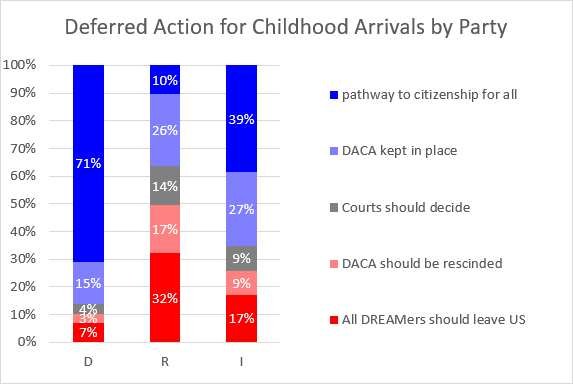
An overwhelming majority of Democrats (86%) support DREAMers, while about ⅓ of Republicans (36%) agree with them. Still, Republicans are divided on this issue with about half (49%) believe that DACA should be rescinded and/or that DREAMers should leave the US.
The country is more supportive of DREAMers than of undocumented migrants in general as can be seen from the following question.
Amnesty for Undocumented Migrants
The survey (answered by 1067 people) asked: “Which of these statements best reflects your opinion on providing a pathway for undocumented migrants?” and provided five possible answers:
- Undocumented migrants should all be deported.
- Undocumented migrants should be required to leave the country before they can apply through normal immigration pathways.
- Undocumented migrants should be provided a (low priority) pathway to legalization.
- Undocumented migrants should be provided a (high priority) pathway to legalization.
- All undocumented migrants should be provided a pathway to full citizenship.
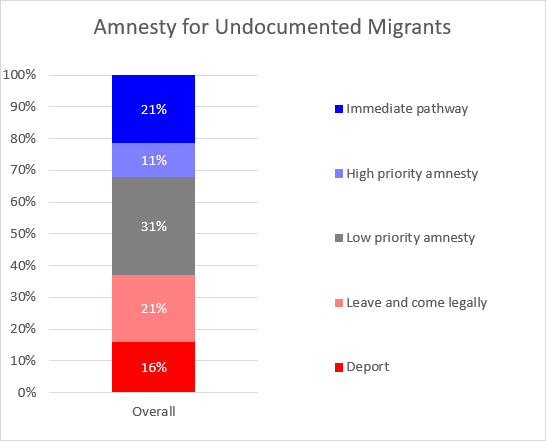
A significant minority of 37% believes that no amnesty should be available, about evenly split in actively deporting all undocumented migrants (16%) and requiring them to leave and only return legally (21%). On the other end of the spectrum, 32% believe in legalizing immediately or with high priority. A middle group of 31% believes that ultimately legalization should be available, but with low priority.
There is a clear partisan split on this issue, as shown in the opinions split out by party affiliation:

About half of Democrats (53%) believe that undocumented migrants should receive amnesty or full citizenship with a high priority, while only 13% of Republicans think the same. Similarly, a majority of Republicans (59%) believe that undocumented migrants should either leave or be deported, while only 22% of Democrats concur.
Clearly, the status of undocumented migrants is a partisan issue.
Immigration Judges
The survey (answered by 998 people) asked: “Which of the following statements best reflects your opinion about immigration judges?” and provided 5 answers:
- The number of immigration judges should be at least doubled.
- The number of immigration judges should be significantly increased.
- The number of immigration judges should be increased somewhat.
- The number of immigration judges is about right.
- The number of immigration judges should be reduced.
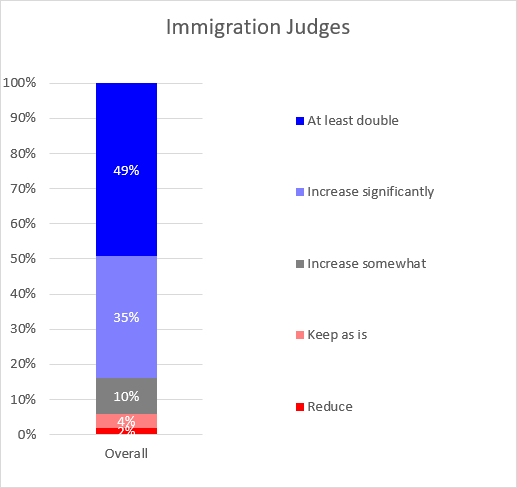
There is overwhelming support (93%) for increasing the number of immigration judges, with almost half believing we should at least double their numbers.

The support for the increase of immigration judges is bipartisan, with 96% of Democrats and 89% of Republicans supporting it.
Asylum Processing Capacity
The survey (answered by 1093 people) asked: “Which of these statements best reflects your opinion on asylum processing capacity?” and provided 5 answers:
- We should release people awaiting their Credible Threat screening while monitoring them with ankle bands and/or check-ins with case workers).
- We should significantly increase the amount of personnel that perform Credible Threat Screenings to reduce detention times.
- We should increase the amount of holding capacity so that we can hold more people longer.
- The current situation is about right.
- We should reject a larger percentage of people during the Credible Threat screening, thereby deterring others from coming to the US.

There are two dominant answers: increase personnel is favored by 59%, while 28% believe we should reject more asylum seekers, which should stem some of the inflow.

There is bipartisan support for increasing personnel, with 70% of Democrats and 47% of Republicans in favor. The difference among those having an other opinion is partisan: the remaining Democrats are split between release and monitor asylum seekers and rejecting faster, while most other Republicans (47%) believe that we should reject more candidates to deter the inflow.
Right To Work for Asylum Seekers
The survey (answered by 925 people) asked: “Which of the following statements best reflects your opinion on asylum seekers being granted the right to work?” and provided 5 answers:
- All asylum seekers should be granted the right to work immediately upon filing the asylum application.
- All asylum seekers should be granted the right to work after a waiting period.
- All asylum seekers should be granted the right to work upon denial of application, giving them the ability to earn an income during the appeals process.
- Only asylum seekers with demonstrated lack of financial means should be permitted to work during their asylum process.
- No asylum seekers should be granted the right to work during the process.
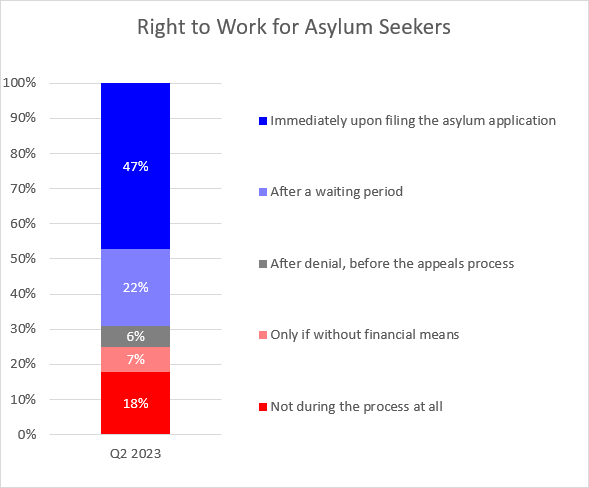
A significant majority (69%) believes that asylum seekers should be allowed to work either immediately or after a waiting period, while a minority (25%) believes that this should only be allowed if they have no financial means, or not at all.
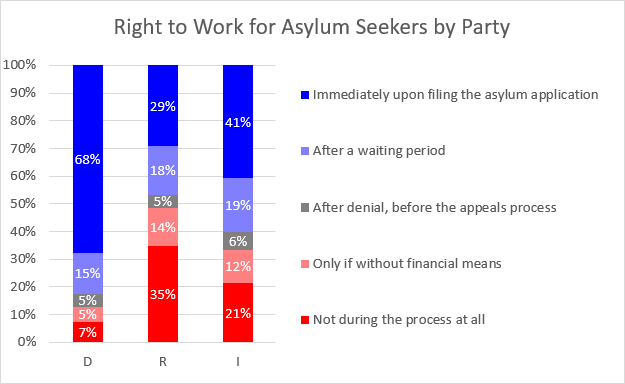
There is a clear partisan divide, with a larger majority (83%) of Democrats favoring the ability to work immediately or after a waiting period, while just under half of Republicans (47%) feel the same way.
2013 Gang of Eight Immigration Bill
Officially named SB744: Border Security, Economic Opportunity, and Immigration Modernization Act, it was voted on in the Senate and passed 68-32 with support of all Democrats and ⅓ of Republicans, but it never received a vote in the House. The survey (answered by 948 people) asked: “How would you vote?”.
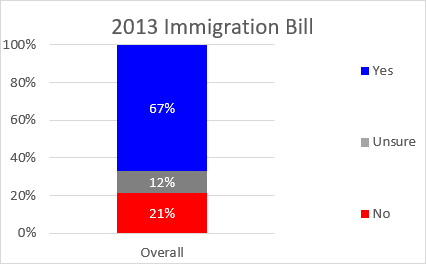
The bill is supported by 67% while only 21% oppose it.
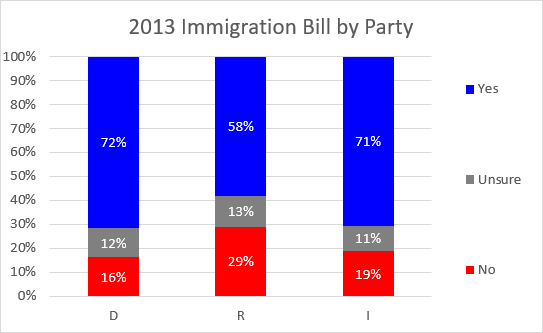
The support for this bill is bipartisan, with Democrats slightly more supportive than Republicans, but even among Republicans there is a 58%-29% split in favor of the bill.
Appendix A – Immigration Survey Content
Each of the participants was provided with optional background information on each of these policy topics before responding. We encourage you to review the survey in detail if you have questions on what each participant read.
Appendix B – ActiVote Polling Methodology
ActiVote collects survey responses from survey takers through the ActiVote app, both available on web and smartphone (the vast majority of participants in this survey used the web version).
The survey responses are weighted based on various characteristics to ensure the sample reflects the opinion of the American public at large. Feel free to review ActiVote’s polling methodology.
Within ActiVote surveys, respondents get immediate feedback after choosing an answer. Participants can change their answer after seeing such feedback, allowing them to reconsider their answer, but also possibly influencing their answer and creating a “bandwagon effect” by respondents selecting among the more popular responses.
ActiVote can interpret the results in three possible ways: we can only include the first answer given per question (thus, ignoring any subsequent changing of answers after seeing the feedback), we can always take the last answer (thus, using the changed answer), or eliminate all survey answers that have been changed (thus, only taking survey answers that were “first time right” in the eyes of the survey taker). For this survey there was on average less than 0.8% difference between using only first time right answers or all answers. We therefore decided to include all answers given.
The number of survey participants ranged from 911 to1223 for the survey questions with an average of 1042, leading to an average expected error of approximately 3%.
.png.webp)


