
Does the data show the U.S. is seeing mostly peaceful protests, or widespread riots? Are we witnessing an epidemic of police brutality, or the spinning of a false media narrative? Are claims of voter fraud a farce, or is it an actual concern? Do economists believe school vouchers are a good idea or not? What you think may depend on what data you have been presented with lately — and how it’s been slanted by partisan media.
We hear a lot about the need for facts and data in finding the truth, but we hear much less about how partisan media outlets can take the very same facts and data to spin vastly different stories and conclusions.
Here are some powerful examples of how slant, bias, and perhaps hidden agendas lead to radically different conclusions from the same data.
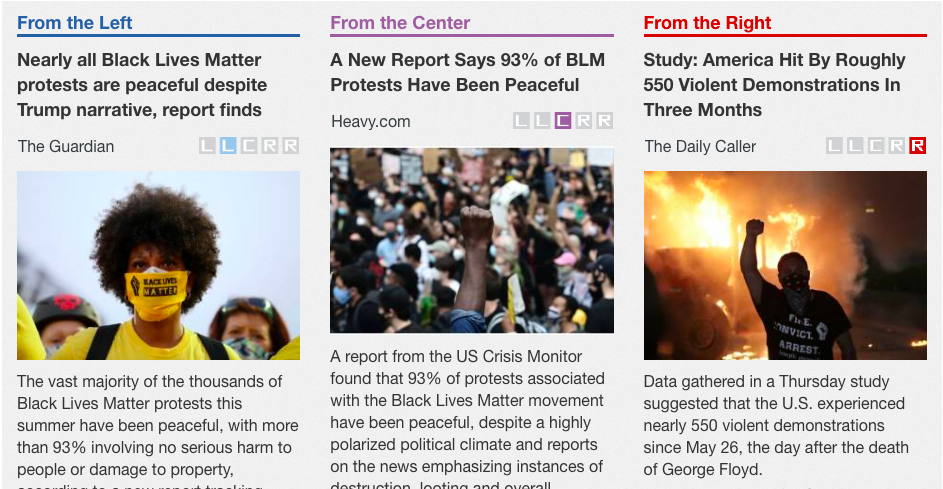
93% peaceful protests, or 550 violent riots?
Some on the left claimed that reports of rioting, arson, looting, and violence at recent protests in U.S. cities were not representative of the majority of anti-police brutality protesters. To back this up, they pointed to a study that purportedly found 93% of Black Lives Matter protests were peaceful, and just 7% were violent.
This same information was framed in vastly different ways by partisan media. Outlets and commentators on the left used it to justify the claim that violence and rioting have been minimal, and those on the right used it to justify their claim that the amount of rioting is both significant and unacceptable.
The difference in conclusions can be seen clearly in this AllSides Headline Roundup on the story from earlier in September. Notice how the left and center media focus on the “93% peaceful” frame, while the right focuses on the “550 violent demonstrations” frame. How do these different slants make you feel about this summer’s events?
Police Brutality: Epidemic or False Narrative?
Perhaps you’ve heard that “black people make up 24% of those fatally shot and killed by the police despite being just 13% of the U.S. population.” Or perhaps you’ve heard something very different: “Just .0004% of the total number of black suspects arrested by police are shot.” That’s because the left and right have interpreted the same data on police shootings of black Americans in very different ways.
While the left says racist police brutality is a huge problem because black Americans are shot at a disproportionate rate by police officers, right-wing commentators say the very same data shows no such racist epidemic.
That’s because on the left, commentators such as Wesley Lowery, writing at the Washington Post (Lean Left), note that black Americans are 2.5 times as likely as white Americans to be shot and killed by police officers. White people are 62% of the U.S. population, but only 49% of those who are killed by police, he writes. Meanwhile, black people are 24% of those fatally shot by police, despite being just 13% of the U.S. population.
And while U.S. police officers have shot and killed the exact same number of unarmed white people as they have unarmed black people (50 each), Lowery says the fact that the white population is approximately five times larger than the black population means black Americans are more likely to get shot and killed by a police officer. The left says this amounts to racist violence.
Meanwhile on the right, conservative commentators such as Heather Mac Donald, writing at The American Mind (Lean Right), say that census data is the wrong benchmark for evaluating police behavior – we should instead look at crime rates among demographics. Black people encounter police more often because they disproportionately commit more crime, committing 53% of homicides and 60% of robberies nationwide, 70% of all drive-by shootings in NYC, and 80% of all shootings and murders (whites less than 2%) in Chicago, even though both blacks and whites are each a little less than a third of the population. In St. Louis, she says, blacks commit up to 100% of all homicides, though they are less than 50% of the population. Officers cannot enforce the law without having a disparate impact on blacks, since blacks commit the greatest share of violent street crime, the right argues.
These arguments from the right, and repeated by some on the left, argue for more analysis and action to address the core causes of greater violence in black communities.
Both sides look at what are generally the same numbers, but disagree on the problem and the cause. The left believes the numbers indicate that there is an epidemic of racist police violence; the right believes that the numbers are not only low but reflect the more critical problem of higher crime rates among black communities — driven by fatherless homes and lack of education, jobs, and safety from drugs and violence — and that is what needs to be addressed.
School Vouchers: Do Economists Approve or Disapprove?
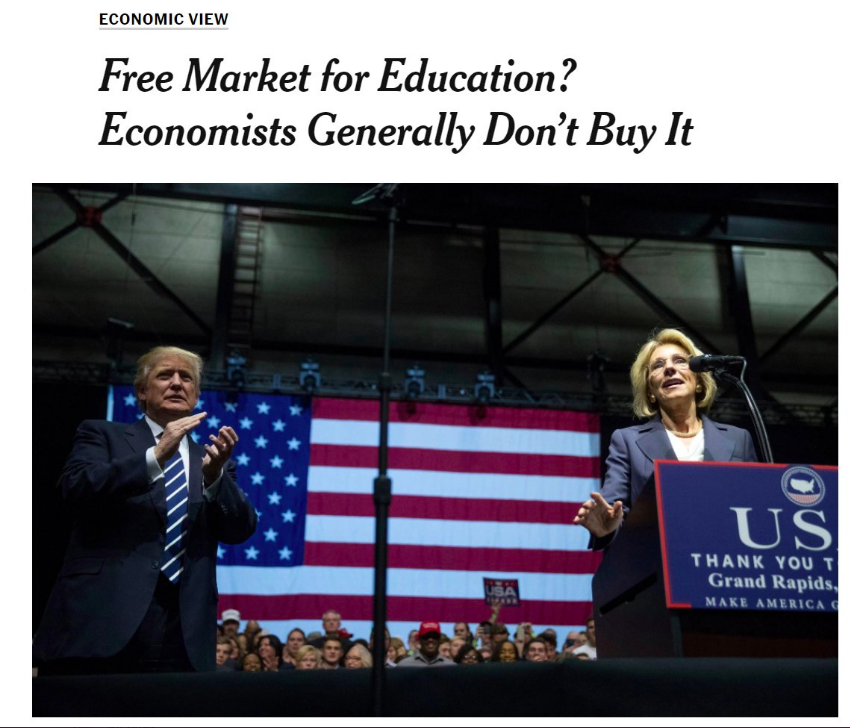
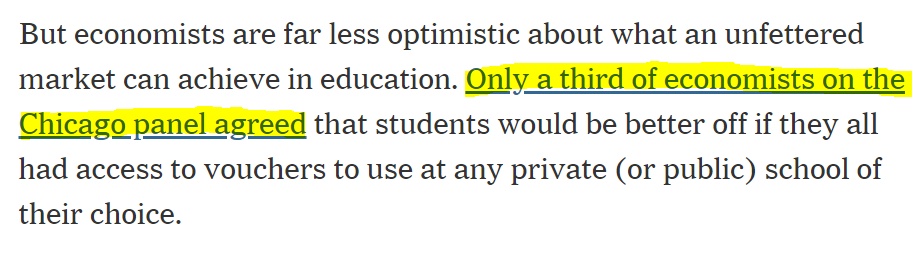
A New York Times (Lean Left) headline about school vouchers declared, “Free Market for Education? Economists Generally Don’t Buy It.” The Times writes, “Only a third of economists on the Chicago panel agreed that students would be better off if they all had access to vouchers to use at any private (or public) school of their choice.”
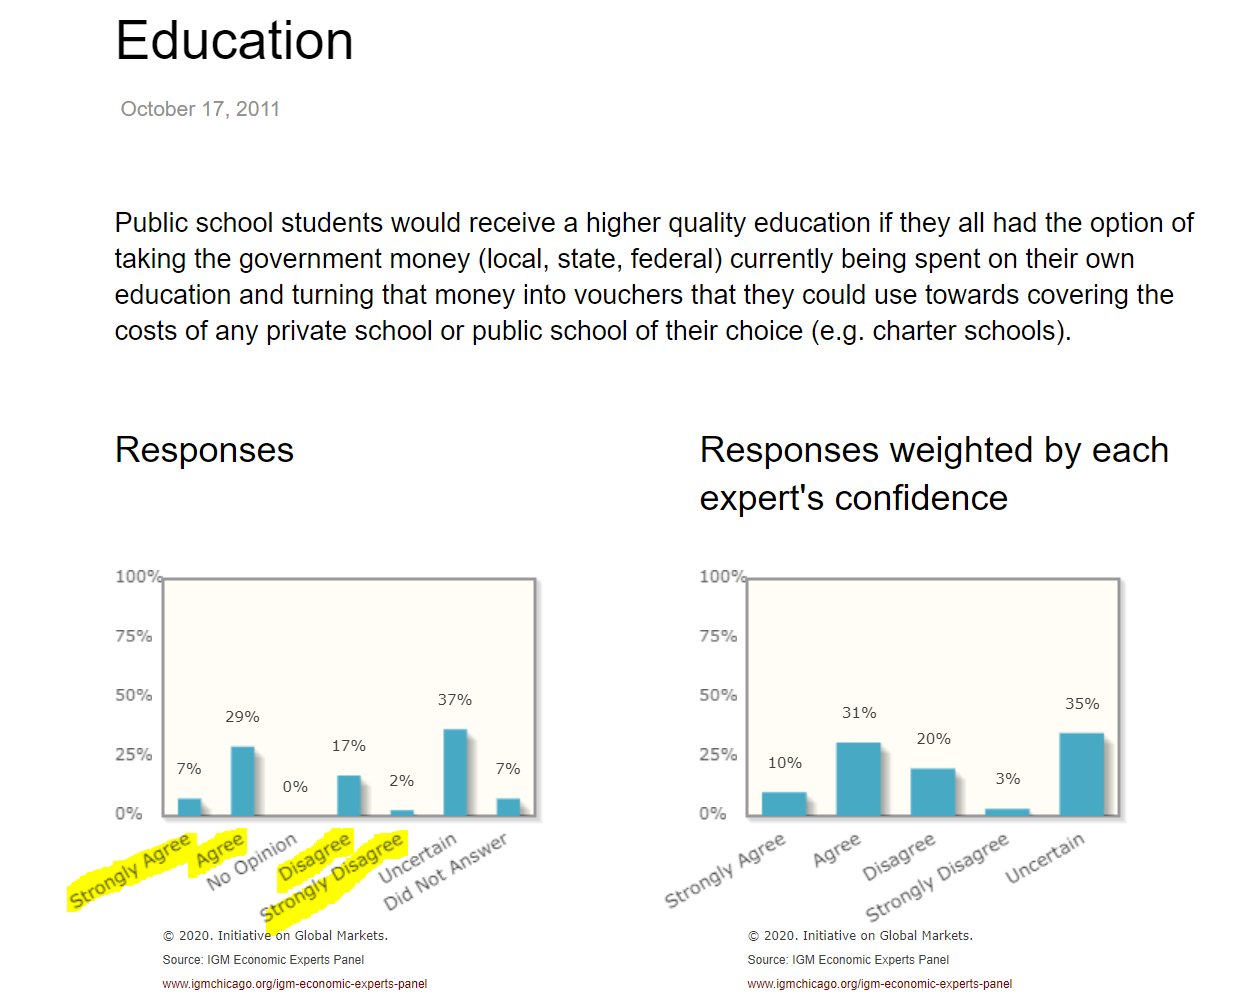
Looking at the raw data, however, 36% of economists agree, 37% are uncertain, and 18% disagree. "Only a third agree” is slightly dishonest framing, as the data actually shows twice as many economists agree with vouchers than disagree, while much uncertainty remains among them. This amounts to media bias by slant, which is when reporters only tell part of a story.
Media bias by slant can be hard to spot, because it requires digging deeper. Few people likely went and looked at the raw data, and trusted the NY Times to interpret it fairly.
Voter Fraud: A Valid Concern or a Way to Disenfranchise People?
The issue of purported voter fraud is another where the left and right use numbers and percentages to back up very different beliefs. The left says there’s no evidence widespread voter fraud occurs, and that even when it does, it is insignificant and thus unlikely to alter the outcome of elections; the right says there are documented cases, those cases are significant enough to have changed election outcomes, and that voter fraud numbers are likely deflated — it’s hard to prove because it’s so easy to get away with.
NPR (Center, though close to Lean Left) called mail-in ballot fraud “not statistically meaningful,” noting that in the last 20 years, more than 250 million ballots have been cast by mail nationwide, and 143 criminal convictions for election fraud related to mail ballots have occurred. “That averages out to about one case per state every six or seven years, or a fraud rate of 0.00006%.”
The right, on the other hand, tends to point to specific cases of fraud or potential fraud — for example, RealClearPolitics (Center, though close to Lean Right) declared that “28 Million Mail-In Ballots Went Missing in Last Four Elections,” and commentary in The Daily Signal (Right) made note of numerous instances, such as the 2018 congressional race in North Carolina that was overturned by the state election board, and the mayor of Gordon, Alabama, who was removed after being convicted of absentee ballot fraud.
Media outlets across the spectrum also use information from The Heritage Foundation’s (Lean Right) often-cited Voter Fraud Database differently. Reuters (Center) says that the project “found 1,296 “proven instances of voter fraud” in U.S. elections going back to 1982, out of billions of ballots cast during that period.”
In response, Heritage called Reuters biased, saying they tried to minimize the problem. The “billions” comparison is “absurd,” they said, as “a single case may involve several conspirators and hundreds of votes. Moreover, billions of votes are not cast in individual local, county or state elections ... fraud could make a difference in a close election.” They also accused Reuters of not updating its story to mention a report that found over 144,000 potential cases of election fraud.
In sum, the right says the available numbers show fraud exists and have changed elections, and that fraud might be much more frequent than reported because it’s so hard to catch; the left looks at the numbers and says it’s not a big problem.
Conclusion
When you come across percentages, numbers and facts used to back up a story or narrative, always be sure to get perspectives across the spectrum to ensure you’re not falling victim to slant. Instead of just listening to soundbites, understand what the numbers mean in the full context of the situation. Even when we think we have all the numbers and facts in front of us, information can be packaged in ways that trick and deceive us.
Julie Mastrine is the Director of Marketing at AllSides. She has a Lean Right bias.
This piece was reviewed by Managing Editor Henry Brechter (Center bias), CEO and co-founder John Gable (Lean Right), COO Stephanie Bond (Lean Left), and Content and Research Assistant Rick Wytmar (Lean Left).
.png.webp)


