
Which map of COVID-19 coronavirus cases elicits more alarm?
This map:

Screenshot: 12:03 pm EST on March 27, Johns Hopkins real-time coronavirus map
Or this map:
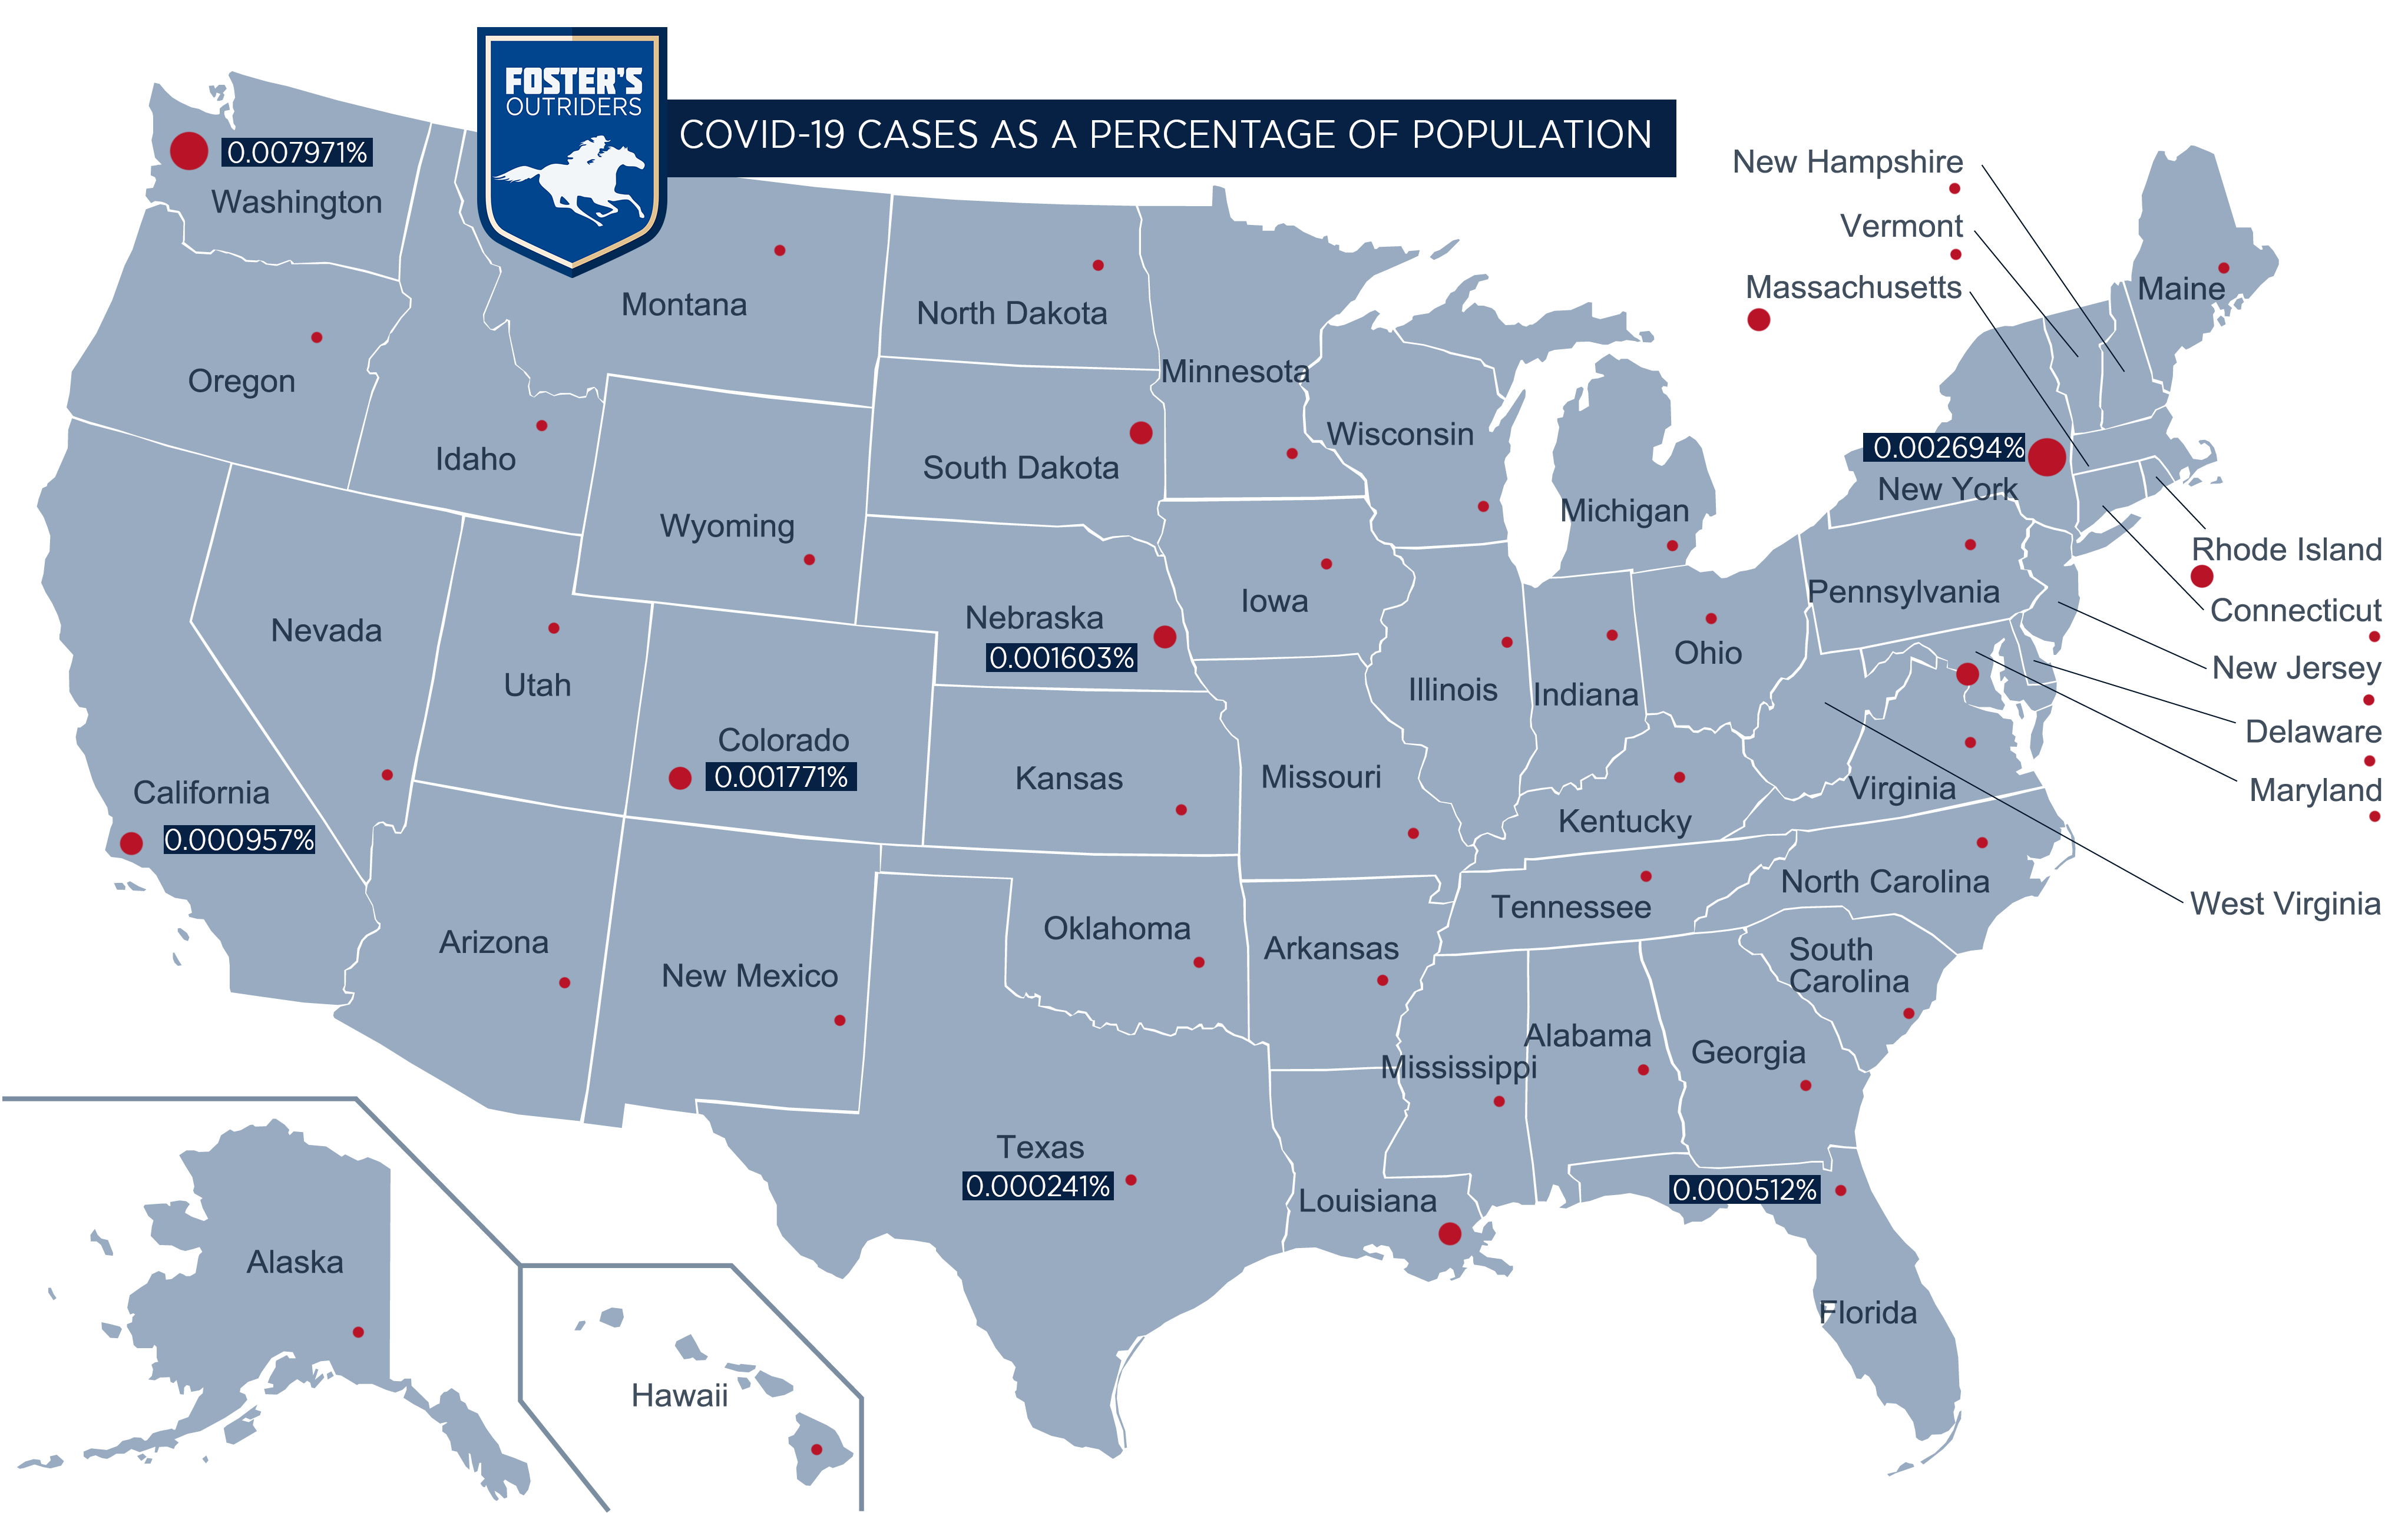
Via Foster’s Outriders, published March 16
These maps are from different days, and COVID-19 cases have been rising exponentially. But they offer very different perspectives on coronavirus cases. The Johns Hopkins map looks at overall infections, while the Fosters map shows infections as a percentage of the population. It’s a good reminder that how we present information can give a very different impression.
Here’s another example:

This map contains a legend that shows the largest circle represents 100 cases, but if you only glanced at it, the map can appear quite shocking. (Note: At least one reporter attributed this map to CNN, but I was unable to verify.)
One could argue that sometimes sensationalism is necessary. Perhaps without those big red dots, people would not be taking this situation seriously and would refuse to implement measures to prevent the virus from spreading, such as physical distancing and staying at home. It’s important to take the coronavirus seriously and to take all preventative measures to stop the spread. It’s also important to get multiple perspectives and to avoid undue panic.
Julie Mastrine is the Director of Marketing at AllSides. She has a Lean Right bias.
This piece was reviewed by Henry Brechter, AllSides Managing Editor. He has a Center bias.
.png.webp)


