Economic Analysis and Research Network
What can state governments do to boost the economic well-being of their people? That is the central question of state economic policy. Incomes and wages can increase across an economy when productivity—production per capita—increases. States have many tools in their arsenal to increase productivity, including investments in public infrastructure, in technological innovation at public universities and other institutions, and in workers through the education and training systems. But many states have been retreating from their responsibility to ensure state economic growth that benefits all residents in favor of a short-sighted approach to economic development. In these states, the focus is on luring employers from other states with strategies that do not lead to rising incomes because they do not make the workforce more productive. Even worse, the focus drains resources from the most important, proven, path to increasing productivity: investments in education.
Major findings of this report include the following:
- Overwhelmingly, high-wage states are states with a well-educated workforce. There is a clear and strong correlation between the educational attainment of a state’s workforce and median wages in the state.
- States can build a strong foundation for economic success and shared prosperity by investing in education. Providing expanded access to high quality education will not only expand economic opportunity for residents, but also likely do more to strengthen the overall state economy than anything else a state government can do.
- Cutting taxes to capture private investment from other states is a race-to-the-bottom state economic development strategy that undermines the ability to invest in education.
- States can increase the strength of their economies and their ability to grow and attract high-wage employers by investing in education and increasing the number of well-educated workers.
- Investing in education is also good for state budgets in the long run, since workers with higher incomes contribute more through taxes over the course of their lifetimes.
Introduction: Education suffers as state economic development wars escalate
Historically, U.S. economic growth and prosperity have been achieved through an implicit partnership of federal, state, and local governments, a partnership that worked astonishingly well for a period after World War II. The federal government provided overall economic stability and sought to ensure that the economy never veered too far from full employment.1 State and local governments assumed primary responsibility for the education system that produced a more skilled and productive workforce. Federal and state governments both invested in infrastructure, and in basic research that provided enormous long-term benefits for the private sector. The end result was a long period of postwar productivity growth, the prerequisite for growth in the standard of living.
During the 1970s and 1980s, state and local governments across the country became convinced that they should play a more aggressive and expansive role in economic policy (Fisher and Peters 1998). Economic development became accepted as a major function of state and local government, and came to mean the direct promotion of private investment within the borders of a state or city. This led to escalating competition for a limited supply of private capital investment through increasingly generous incentive packages.
While cutting costs to business has become the principal focus of economic development policy in many states, more and more states are cutting programs across the spectrum to lower state taxes. In many cases these ideas are promoted as a way to attract employers from other states—to steal jobs by offering incentives to business leaders. But the preponderance of evidence has shown that in the long run these strategies are inefficient and ineffective (Fisher 2013; Mazerov 2013; Lynch 2004). State and local taxes on business are simply too small a share of total business costs to play a significant role in location decisions; other factors—labor skills, wages, access to inputs and markets—are much more important. Yet business tax breaks are expensive, and take money from investments in education and infrastructure that increase productivity and support growth.
And as public resources are squandered on unproductive state efforts to capture private investment at the expense of other states, it becomes more difficult to fund the kind of education system innovations needed to raise U.S. educational performance up to the levels of other advanced industrial societies. Furthermore, investments in public research universities are important to enhancing the nation’s rate of innovation as basic research is spun off in new private ventures, and to maintaining or recapturing our leadership role in new technologies. Inadequate investments in education weaken the ability of a state to develop, grow, and attract businesses that offer high-skilled, high-wage jobs.
Strong state education systems are good not just for the national economy; they are good for the citizens of the state. Ultimately, state economic policies seek to improve the lives of the people in the state, which means creating conditions in which people can get jobs that pay enough to support a family and provide economic security. This leads to a virtuous cycle, as working people who can afford to buy goods and services support local businesses and the local economy.
The connection between education and income is strong. A high school diploma, technical college certificate, or college degree not only increases one’s skills and productivity, but signals to employers that the individual is motivated and completes tasks. A more educated individual is more likely to participate in the job market, to have a job, to work more hours, and to be paid more, and less likely to be unemployed (French and Fisher 2009). But the benefits of education go beyond the economic returns. Higher levels of education also correspond to improved health and lower rates of mortality, and lower rates of crime (Grossman and Kaestner 1997; Lleras-Muney 2005; Lochner and Moretti 2004).
Research has also shown that greater parent education correlates positively with children’s health, cognitive abilities, and academic achievement (Wolfe and Zuvekas 1995; Haveman and Wolfe 1995; Smith, Brooks-Gunn, and Klebanov 1997). The children of more highly paid workers are also less likely to grow up in poverty, less likely to be poor as adults, and more likely to be better educated and paid as adults, and therefore less likely to rely on food stamps or other public assistance (French and Fisher 2009; Duncan, Kalil, and Ziol-Guest 2008). The benefits of a more educated population accrue not just to the more educated workers, but to future generations and to the broader society.
The productivity-education link
The best way to measure whether an economy is working is to look at whether the incomes of average people are increasing. To achieve rising incomes for average people, two things need to happen: productivity needs to increase (creating more income overall), and new income generated from their increased productivity needs to be returned to workers in the form of higher wages.
Ensuring the fair distribution of the rewards of productivity growth is primarily a federal responsibility, through such things as strong labor laws, fair trade policies, and monetary and fiscal policies that encourage full employment. There are some steps states can take in this area, such as maintaining strong labor standards, including minimum wage laws that protect the lowest paid workers.
Where states have the greatest role to play, however, is in making sure that all of their people—and particularly in those from the most disadvantaged backgrounds—have the tools to be highly productive. Education is the key to that, as are other things that make learning possible, such as making sure children have decent health care and sufficient nutrition. Reducing poverty itself has also been shown to improve the ability of children to thrive (Marr, Charite, and Huang 2013).
Evidence suggests that states that increase the level of education of their workforce see greater productivity. As shown in Figure A, between 1979 and 2012, states in which the share of adults with at least a college degree experienced greater increases in productivity, measured as gross state product per hour worked.
Productivity has grown more in states with greater growth in the educational attainment of their workforce: Relationship between state productivity growth and increase in college attainment from 1979 to 2012
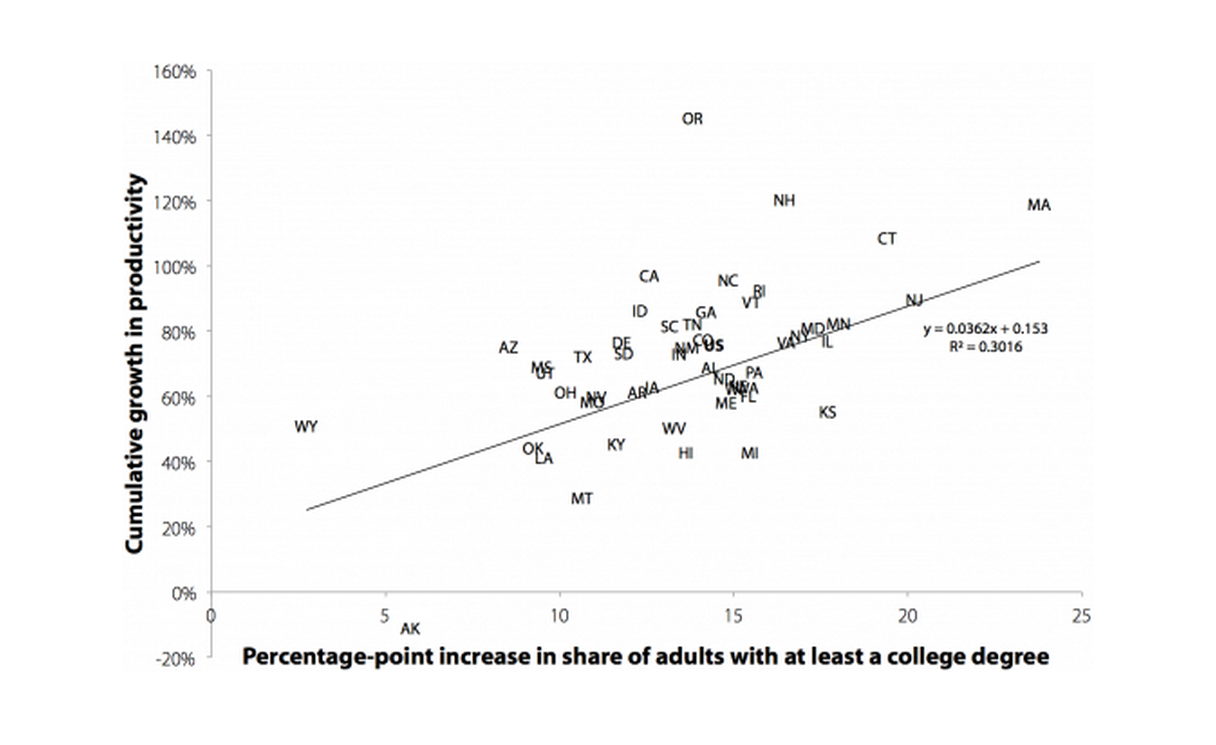
Source: EPI analysis of unpublished total economy productivity data from the Bureau of Labor Statistics (BLS) Labor Productivity and Costs program, state employment data from BLS Local Area Unemployment Statistics, and college attainment data from the Current Population Survey basic monthly microdata
There is also evidence that greater productivity is associated with higher wages. Figure B shows that between 1979 and 2007, states with larger increases in productivity experienced larger increases in median worker compensation.
Worker compensation has increased more in states with greater increases in productivity: Relationship between change in state median worker compensation and productivity from 1979 to 2012
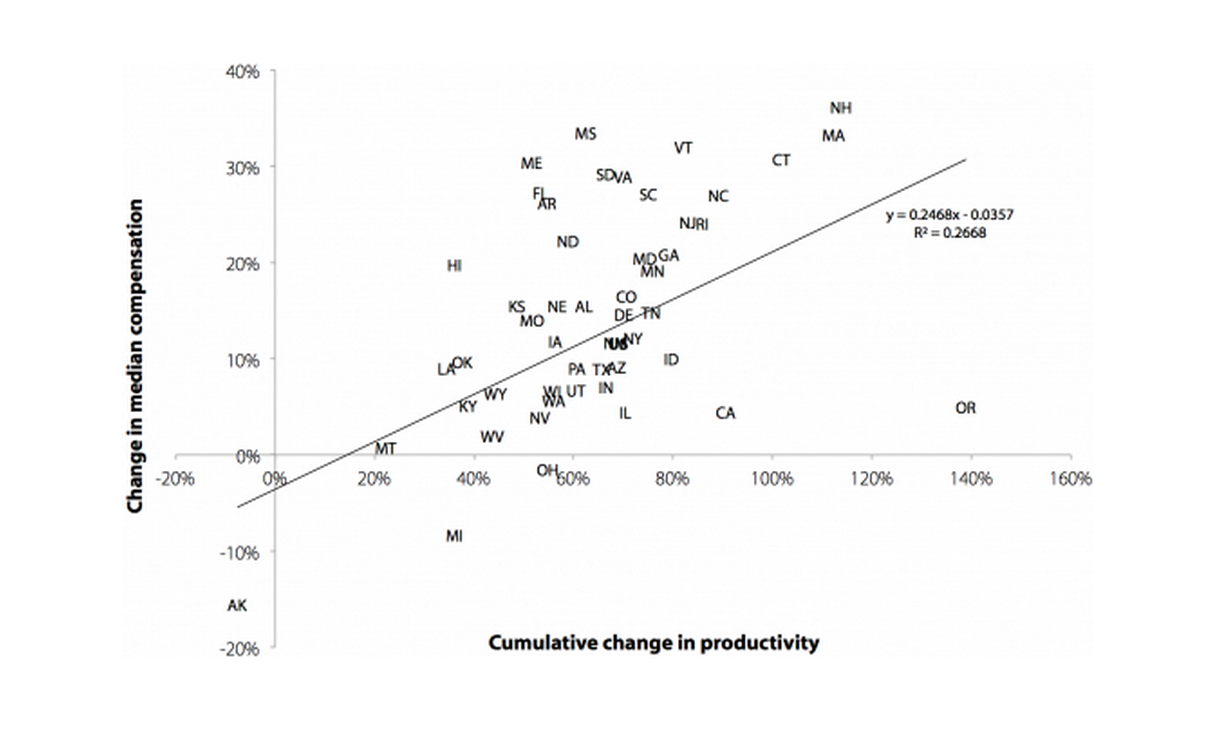
Source: EPI analysis of unpublished total economy productivity data from the Bureau of Labor Statistics (BLS) Labor Productivity and Costs program, state employment data from BLS Local Area Unemployment Statistics, state compensation data from the Bureau of Economic Analysis State/National Income and Product Accounts public data series, and wage data from BLS Current Population Survey (CPS) Outgoing Rotation Group microdata
Education, wages, and state economic success
The previous section established the link between education and productivity, and productivity and wages. We can further test the assumed link between education (and, alternatively, tax rates) and wages by reviewing correlations between certain characteristics and high-wage state economies. We focus on the median wage (which includes hourly wages and salaries converted to an hourly basis) as the most appropriate measure of state economic success for several reasons. It should be the goal of state development policy to raise the standard of living, which requires both improvements in productivity and that the gains from productivity (how much output is generated by the economy in each hour of work) be shared with workers in the form of higher wages and salaries. Productivity improvements that only enhance profits will benefit only those at the top of the income and wage distributions. And average wages, as opposed to median wages, will rise even when all the gains are captured by those at the top. Indeed, national data reveal that the increasing concentration of profits and wage growth at the top is behind the growing “wedge” between productivity growth and median wages in the United States (Mishel et al. 2012). Yet even despite this growing wedge, higher rates of education are strongly predictive of higher median wages across states (as shown below).
We use wages rather than income because wages are directly affected by state efforts to increase labor skills while investment income could derive from ownership of assets anywhere in the world. Furthermore, for most of the population, improvements in wages are the principal, if not the only, path to improving income. We do not use growth in jobs or in output (state GDP) because an increase in jobs or in output does not necessarily translate into an improved standard of living; an influx of low-wage jobs can drive down average pay, and an increase in output can occur with little increase in employment or wages if it comes about through substituting capital for labor.
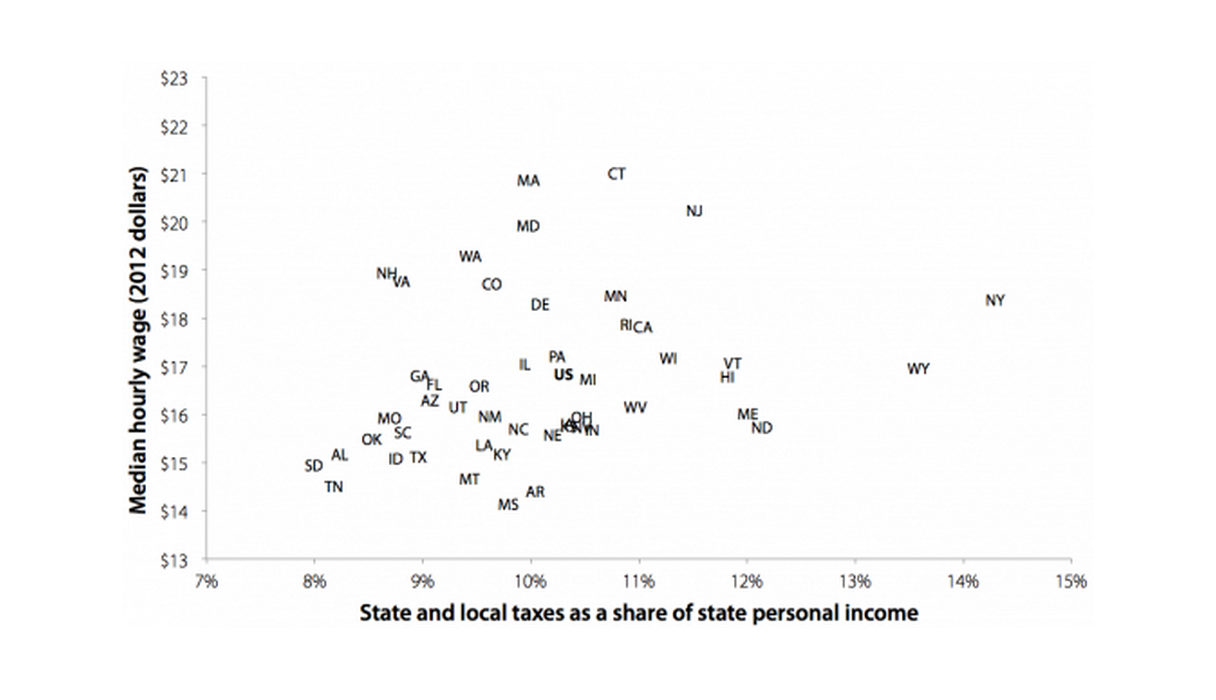
Our analyses allow us to answer several important questions. First, “are high-wage economies more common in low-tax states?” The answer, as shown in Figure C, is “no.”
There is no significant correlation between overall tax levels and high-wage economies: Median hourly wage, and state and local taxes as a share of state personal income, by state, 2010
| State | State and local tax revenue as a share of state personal income | Median Hourly Wage (2012 dollars) |
|---|---|---|
| WY | 0.13590238 | $16.97 |
| AR | 0.10037558 | $14.42 |
| NV | 0.10475355 | $15.76 |
| MS | 0.097939908 | $14.16 |
| LA | 0.09574187 | $15.38 |
| WV | 0.10971793 | $16.17 |
| IN | 0.10564875 | $15.70 |
| KY | 0.097442473 | $15.19 |
| OH | 0.10470439 | $15.97 |
| SD | 0.079988074 | $14.96 |
| ID | 0.087547352 | $15.10 |
| OK | 0.08531404 | $15.51 |
| UT | 0.093340332 | $16.17 |
| AK | 0.1974031 | $18.69 |
| SC | 0.088154942 | $15.65 |
| AL | 0.082354177 | $15.19 |
| TX | 0.089617786 | $15.14 |
| TN | 0.081749962 | $14.53 |
| IA | 0.10341089 | $15.82 |
| AZ | 0.09064911 | $16.31 |
| NC | 0.098868851 | $15.71 |
| MT | 0.094412722 | $14.69 |
| WI | 0.11274396 | $17.19 |
| MI | 0.1053127 | $16.75 |
| NE | 0.10207951 | $15.59 |
| MO | 0.086906169 | $15.95 |
| FL | 0.091142418 | $16.65 |
| ME | 0.12008039 | $16.04 |
| PA | 0.10247088 | $17.23 |
| NM | 0.096224878 | $15.98 |
| HI | 0.11820127 | $16.81 |
| ND | 0.12142884 | $15.75 |
| GA | 0.089791357 | $16.82 |
| US | 0.1031523 | $16.85 |
| DE | 0.10092502 | $18.31 |
| OR | 0.095232536 | $16.61 |
| RI | 0.10883045 | $17.88 |
| CA | 0.11036228 | $17.83 |
| WA | 0.094482239 | $19.30 |
| MN | 0.10786811 | $18.48 |
| KS | 0.10357631 | $15.77 |
| VT | 0.11876957 | $17.09 |
| IL | 0.099506408 | $17.07 |
| NH | 0.086699291 | $18.96 |
| NY | 0.1430054 | $18.39 |
| VA | 0.088036271 | $18.78 |
| CO | 0.096436107 | $18.73 |
| NJ | 0.11515426 | $20.26 |
| MD | 0.099771245 | $19.93 |
| CT | 0.1080529 | $21.03 |
| MA | 0.099847735 | $20.88 |
Source: Authors' analysis of Current Population Survey Outgoing Rotation Group microdata and Tax Policy Center's Tax Facts data
The figure shows no clear relationship between state taxes (as a share of state personal income) and median wages. Higher-tax states appear to have slightly higher median wages, but that correlation is not significant.
One conclusion from this chart could be that it is very unlikely that we would ever see a clear pattern when looking at wages across all 50 states—because states are so different in so many ways.
Testing the accuracy of this conclusion leads to our second question: “Is there a factor that does show a strong correlation with high-wage economies?” The answer is “yes.”
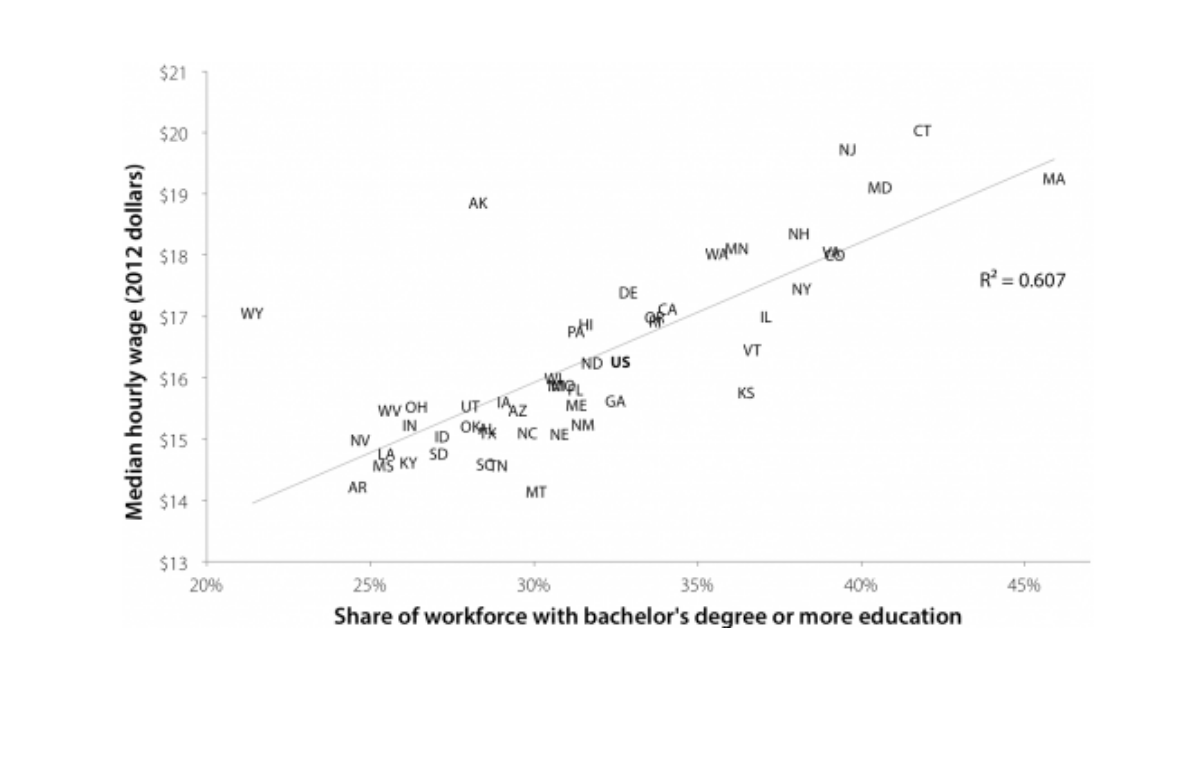
Overwhelmingly, high-wage states are states that have a well-educated workforce, evident in Figure D. The correlation is very strong and there are very large differences between median hourly wages in states with well-educated workforces and hourly wages in states with less-well-educated workforces (as measured by the share of workers who have at least a bachelor’s degree). In the 22 states with the least-educated workforces (30 percent or less with a bachelor’s degree or more education), median wages hover around $15 an hour, the only exceptions being Alaska and Wyoming. In the three states where more than 40 percent of the population has a bachelor’s or more education, median wages are $19 to $20 an hour, nearly a third higher. For a full-time, full-year worker, a median wage of $15 versus $20 an hour means the difference between making $30,000 a year and making $40,000 a year. For a household with one person working full time and one person working half time, it is the difference between making $45,000 a year and making $60,000 a year.
Median wages are substantially higher in states with better-educated workers: Relationship between state median hourly wage and share of state's workforce with a bachelor's degree or more education, 2012
| State | Share of labor force with bachelor’s degree or more education | Median Hourly Wage (2012 dollars) |
|---|---|---|
| WY | 0.214 | $17.07 |
| AR | 0.246 | $14.23 |
| NV | 0.247 | $15.00 |
| MS | 0.254 | $14.58 |
| LA | 0.255 | $14.78 |
| WV | 0.256 | $15.48 |
| IN | 0.262 | $15.24 |
| KY | 0.262 | $14.63 |
| OH | 0.264 | $15.54 |
| SD | 0.271 | $14.78 |
| ID | 0.272 | $15.06 |
| OK | 0.281 | $15.22 |
| UT | 0.281 | $15.55 |
| AK | 0.283 | $18.87 |
| SC | 0.285 | $14.60 |
| AL | 0.286 | $15.18 |
| TX | 0.286 | $15.12 |
| TN | 0.289 | $14.58 |
| IA | 0.291 | $15.62 |
| AZ | 0.295 | $15.48 |
| NC | 0.298 | $15.12 |
| MT | 0.301 | $14.16 |
| WI | 0.306 | $16.01 |
| MI | 0.307 | $15.89 |
| NE | 0.308 | $15.10 |
| MO | 0.309 | $15.89 |
| FL | 0.313 | $15.82 |
| ME | 0.313 | $15.57 |
| PA | 0.313 | $16.77 |
| NM | 0.315 | $15.25 |
| HI | 0.316 | $16.89 |
| ND | 0.318 | $16.26 |
| GA | 0.325 | $15.64 |
| US | 0.327 | $16.28 |
| DE | 0.329 | $17.41 |
| OR | 0.337 | $17.00 |
| RI | 0.337 | $16.94 |
| CA | 0.341 | $17.14 |
| WA | 0.356 | $18.04 |
| MN | 0.362 | $18.13 |
| KS | 0.365 | $15.77 |
| VT | 0.367 | $16.47 |
| IL | 0.371 | $17.01 |
| NH | 0.381 | $18.37 |
| NY | 0.382 | $17.47 |
| VA | 0.391 | $18.07 |
| CO | 0.392 | $18.02 |
| NJ | 0.396 | $19.74 |
| MD | 0.406 | $19.12 |
| CT | 0.419 | $20.05 |
| MA | 0.459 | $19.27 |
Source: Authors' analysis of Current Population Survey (CPS) basic monthly and CPS Outgoing Rotation Group microdata
In addition to the magnitude of the differences between states there is also a striking consistency: There are no states with a relatively well-educated workforce and relatively low wages and virtually no states with low levels of education and relatively high wages. There are two outliers: Alaska and Wyoming. Their locations on the graph suggest that states with valuable natural resources and a very limited number of people may be able to offer reasonably high wages without a well-educated workforce. In the case of Alaska, it may also be a matter of being forced to offer high nominal wages to attract workers because of the high cost of living.2 But these are clearly special cases.
In some ways, the correlation between wages and education should not be surprising. For an individual, annual earnings rise with increasing education, as shown in Figure E. Higher median annual earnings for those with more education reflect not just higher hourly pay, but more stable employment and fewer periods of unemployment.
Wages are higher for better-educated workers: Median annual earnings of U.S. workers, age 25+, by education, 2011
| Education level | Median annual earnings |
|---|---|
| High school dropout | $20,329 |
| High school graduate | $28,659 |
| Associate degree | $36,853 |
| Bachelor’s degree | $49,648 |
| Master’s degree | $60,709 |
Source: Current Population Survey, 2012 Annual Social and Economic Supplement
It makes sense that if an individual’s wages increase with education, then wages across an economy likely increase as more people have higher levels of education. Businesses that need well-educated workers, and pay the wages such workers earn, will grow and prosper in states that have such workers and may be forced to leave states that don’t.
While this correlation between education and high-wage jobs is not surprising, what perhaps should be surprising is how often policymakers ignore it and pursue other quick fixes, such as special tax breaks or other subsidies for businesses. Looking at the correlation between education and wages, there is little indication that states have found a way to create a high-wage economy without a well-educated workforce.
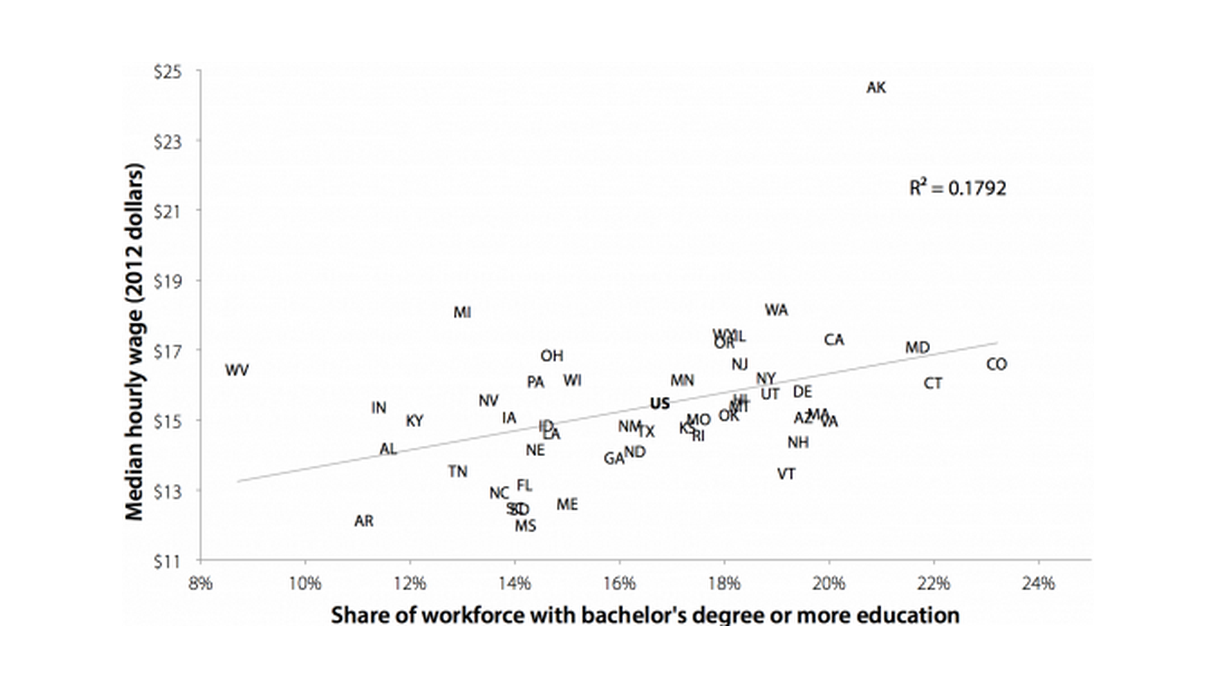
Interestingly, this was not always the case. If we turn back the clock to the late 1970s, we see a very different picture, represented in Figure F. Alaska is again an outlier. But behind Alaska, the highest-wage state was Michigan, which didn’t have a particularly well-educated workforce. Ohio and West Virginia also had reasonably high wages but not well-educated workforces. At the other end of the spectrum, many states with more well-educated workforces didn’t have particularly high-wage economies. We had a very different economy in the 1970s and the wage premium for a college degree (the gap between wages of college and high school graduates) was much smaller. It then grew significantly in the 1980s and 1990s (Mishel et al. 2012, Figure 4N).
There was a much weaker correlation between education and wages as recently as 1979: Relationship between state median hourly wage and share of state workforce with a bachelor's degree or more education in 1979
| State | Share of labor force with bachelor’s degree or more education | Median Hourly Wage |
|---|---|---|
| WY | 0.18 | $17.48 |
| AR | 0.111 | $12.15 |
| NV | 0.135 | $15.60 |
| MS | 0.142 | $12.02 |
| LA | 0.147 | $14.65 |
| WV | 0.087 | $16.47 |
| IN | 0.114 | $15.39 |
| KY | 0.121 | $15.02 |
| OH | 0.147 | $16.88 |
| SD | 0.141 | $12.48 |
| ID | 0.146 | $14.86 |
| OK | 0.181 | $15.17 |
| UT | 0.189 | $15.78 |
| AK | 0.209 | $24.54 |
| SC | 0.14 | $12.52 |
| AL | 0.116 | $14.22 |
| TX | 0.165 | $14.72 |
| TN | 0.129 | $13.57 |
| IA | 0.139 | $15.10 |
| AZ | 0.195 | $15.11 |
| NC | 0.137 | $12.95 |
| MT | 0.183 | $15.42 |
| WI | 0.151 | $16.17 |
| MI | 0.13 | $18.12 |
| NE | 0.144 | $14.19 |
| MO | 0.175 | $15.06 |
| FL | 0.142 | $13.18 |
| ME | 0.15 | $12.64 |
| PA | 0.144 | $16.12 |
| NM | 0.162 | $14.87 |
| HI | 0.183 | $15.62 |
| ND | 0.163 | $14.13 |
| GA | 0.159 | $13.95 |
| US | 0.168 | $15.52 |
| DE | 0.195 | $15.86 |
| OR | 0.18 | $17.25 |
| RI | 0.175 | $14.59 |
| CA | 0.201 | $17.33 |
| WA | 0.19 | $18.19 |
| MN | 0.172 | $16.18 |
| KS | 0.173 | $14.81 |
| VT | 0.192 | $13.50 |
| IL | 0.183 | $17.44 |
| NH | 0.194 | $14.41 |
| NY | 0.188 | $16.23 |
| VA | 0.2 | $15.00 |
| CO | 0.232 | $16.64 |
| NJ | 0.183 | $16.64 |
| MD | 0.217 | $17.11 |
| CT | 0.22 | $16.18 |
| MA | 0.198 | $15.21 |
Source: Authors' analysis of Current Population Survey (CPS) basic monthly and CPS Outgoing Rotation Group microdata
Additionally, Figure F shows higher median wages in states with strong labor unions: Michigan, Ohio, Pennsylvania, Wisconsin, California, and New Jersey, for example. Historically, there has been a strong correlation between union density—the percent of a state’s workforce represented by a union—and state median wages.3 Today there are no states with the levels of union density that the high-wage states had in the late 1970s. Not surprisingly, the share of corporate revenue that is paid in wages rather than distributed in profits has declined significantly (Jacobson and Occhino 2012). Unions now represent a much smaller share of the workforce than they did in the decades immediately following World War II and so are not the force that they were for creating middle-class jobs for large numbers of workers with a high school education or less.
Education as smart economic development policy
Does the correlation between education and earnings necessarily mean that states can strengthen their economies in the long run by adopting policies that increase the number of well-educated workers? Recent academic work suggests that the answer is, “Yes.” A study by Federal Reserve economists examined the factors contributing to greater state prosperity over a 65-year period and found that a state’s high school and college attainment rates were important factors in explaining its per capita income growth relative to other states between 1939 and 2004 (Bauer, Schweitzer, and Shane 2006).
Increasing educational attainment can be achieved by a variety of policies and programs, including those that increase access to postsecondary education by restraining tuition growth or increasing financial aid, reduce high-school drop-out rates, move people without high school degrees through GED and associate degree programs, increase the quality of K-12 education to improve success of high school graduates in postsecondary education, and offer preschool programs that lead to long-term improvements in educational outcomes.
An evaluation of the effectiveness of alternative education strategies is beyond the scope of this report. But there is evidence that state expenditures on primary and secondary education improve school performance and raise state per capita income. For example, investments in school facilities led to improvements in student test scores (Cellini, Ferreira, and Rothstein 2010). And over a 34-year period, states that improved their position relative to other states on real per-capita education spending improved their relative position in real per-capita income, and the direction of causality was from education spending to income (Bensi, Black, and Dowd 2004). Also, the long-term benefits of early childhood education programs have been well documented (Lynch 2007).
Some state officials may be tempted to ask, “What good would it do to produce more college graduates if better-paying jobs for college graduates are not available?” “Shouldn’t the state focus on attracting higher-skilled jobs instead of creating more skilled workers who have to leave the state to find work?” But in this instance, if not in most others in economic policymaking, increased supply can actually help create its own demand. As Bartik has put it, “An increase in the labor supply probably stimulates labor demand by at least two-thirds the supply increase. This is because additional labor attracts employers, and additional higher-skilled labor attracts employers with more skilled jobs” (Bartik 2009). To a degree then, the answer to these concerns is, “If you educate them, jobs will come,” though national strategies to increase the demand for skilled workers may also be needed.
Education investments are good not only for a state’s economy and residents, but also for a state’s budget in the long run. This may seem counterintuitive since education is a large share of state-financed expenditure—typically over half if including postsecondary education and state aid to K-12 school systems.4 But education investments can pay off for the state in the long run. The majority of students graduating from state schools will remain in the state over their working lives, and as a result of being better trained, will have better jobs. This means they will earn more and stay employed at a higher rate, paying more income and sales taxes and relying less on state assistance programs. There is evidence that every additional student who gets an associate or bachelor’s degree instead of stopping formal education after graduating from high school will, over his or her lifetime, return to the state, in the form of higher taxes, substantially more than the cost of their education. This means that scholarships or other programs that lead more students to higher education can more than pay for themselves, even if a third of the graduates leave the state (French and Fisher 2009). The overall returns from investments in early childhood education mean that such investments will generally pay for themselves (Lynch 2007).
States would do well if they focused their resources on their historic role as the guarantors of high quality education for all, while broadening the scope of that role to include universal preschool and other early childhood education programs, and beginning to view high quality postsecondary education and training as the standard for all students. In most states that would mean reversing recent cuts to, and even elimination of, publicly funded preschool,5 and declines in public investments in postsecondary education. From 1990–1991 to 2009–2010, real funding per student at public colleges and universities declined 26 percent, and the share of state personal income going to higher education fell 30 percent, while tuition at four-year institutions more than doubled and at community colleges rose 71 percent (Quinterno 2012). Instead of improving access to higher education in response to the needs of a changing economy, most states have restricted it.
Conclusion
Ultimately, the wealth of a society can increase only if the economy becomes more productive. A more productive economy can support both higher wages and higher profits, as well as shorter work weeks and a higher quality of life. So the question of how to increase productivity needs to be at the center of any debate about state economic development.
As this paper shows, moving jobs from one state to another state does nothing to increase productivity. Rather, productivity rises with investments in infrastructure and workers, with investments in education that raise educational achievement providing a major boost. Thus, investing in education is a core contribution states can make to the well-being of their residents and the national economy overall.
At the same time, increasing productivity does not by itself guarantee that the resulting economic gains will be broadly shared. At the national level, productivity and wages grew hand in hand from the end of World War II until the early 1970s (Mishel et al. 2012). But since then, wages have largely stagnated while productivity has continued to rise. From 1973 to 2011 productivity increased 80.4 percent while real median hourly compensation (wages and benefits) of production/nonsupervisory workers in the private sector grew just 10.1 percent (Mishel et al. 2012, Figure 4V). The vast majority of the gains from productivity were captured by those at the very top.
While national policies will have to play the major role in creating a national economy in which economic growth leads to incomes rising across the income spectrum, there are measures that states can take to strengthen the ability of working people to participate fully in the gains from economic growth. These include restoring state minimum wages to the real level that prevailed in the late 1960s, aggressively addressing problems of wage theft and employee misclassification, adopting higher wage standards in economic development programs, and other measures.
But most importantly, states can build a strong foundation for economic success and shared prosperity by investing in strategies that make their people more productive, chief among them education. Providing expanded access to high quality education and related supports—particularly for those young people who today lack such access—will not only expand economic opportunity for those individuals, but will also likely do more to strengthen the overall state economy than anything else a state government can do.
About the Authors
Noah Berger is president of the Massachusetts Budget and Policy Center, an independent research organization that analyzes state budget and tax policies, as well as economic issues that affect low- and moderate-income people in Massachusetts. Prior to joining the center, Berger served as counsel and policy director for the Massachusetts Senate Committee on Ways and Means from 1993 to 1996 and as policy director for Massachusetts Senate President Tom Birmingham from 1996 to 2002. Berger’s leadership extends to the national arena, where he serves on the board of directors for Public Works, on the advisory board of the Tax Policy Center, and on the EARN advisory group. Berger graduated from Harvard College and has a J.D. from Harvard Law School.
Peter Fisher is the research director at the Iowa Policy Project. Fisher is a national expert on public finance and has served as a consultant to the Iowa Department of Economic Development, the State of Ohio, and the Iowa Business Council. His reports are regularly published in State Tax Notes and refereed journals. His most recent book is Grading Places: What do the Business Climate Rankings Really Tell Us, 2nd edition, published in 2013 by Good Jobs First. He has authored or co-authored the majority of Iowa Fiscal Partnership reports and guest opinions on state tax policy. Fisher is professor emeritus of Urban and Regional Planning at the University of Iowa. Fisher has a Ph.D. in economics from the University of Wisconsin-Madison.
Endnotes
1. An economy has reached full-employment when any further increases in aggregate demand would fail to reduce the unemployment rate. Note that this, of course, does not mean the unemployment rate will be zero —some degree of “frictional” unemployment (temporary unemployment as workers move between jobs and move from out of the labor force into paid employment) and “structural” unemployment (a mismatch between workers demanded by employers and those available in any given local labor market) will always persist. The Employment Act of 1946 called for the federal government to maintain full employment, and fiscal and monetary policy in the ensuing postwar period was used to attain that goal while keeping inflation low. In more recent decades, concern with inflation has often taken precedence over unemployment in Federal Reserve monetary policy, and the effectiveness of fiscal policy to stimulate the economy has been challenged by those who would shrink government at all costs.
2. According to the Bureau of Economic Analysis, Alaska has the ninth highest cost of living (Aten, Figueroa, and Martin 2012).
3. In 1979, for example, the correlation between state union coverage and state median wage was .67. Union coverage by state and year comes from the Current Population Survey and can be found at unionstats.com (Hirsch and Macpherson 1979). Median hourly wage data are also from the Current Population Survey as analyzed by the Economic Policy Institute.
4. In 2011, expenditures for education accounted for 36 percent of total state government expenditure in the United States, but 56 percent of state own-source revenue (U.S. Census Bureau Annual Survey of State Government Finances 2011)
5. “Of the 39 states with some form of public pre-K program, about half have cut spending since the start of the recession” (Knafo 2012). Per pupil spending on preschool programs has been on the decline for a decade (Barnett et al. 2011).
References
Aten, Bettina H., Eric B. Figueroa, and Troy M. Martin. 2012. Regional Price Parities for States and Metropolitan Areas, 2006–2010. Bureau of Economic Analysis, August.
Barnett, W.S., M.E. Carolan, J. Fitzgerald, and J.H. Squires. 2011. The State of Preschool 2011: State Preschool Yearbook. New Brunswick, N.J.: National Institute for Early Education Research. http://nieer.org/publications/state-preschool-2011
Bartik, Timothy J. 2009. “What Works in State Economic Development?” In Growing the State Economy: Evidence-Based Policy Options, 1st edition, Stephanie Eddy, and Karen Bogenschneider, eds. Madison, Wis.: University of Wisconsin, 15–29. http://research.upjohn.org/bookchapters/18/
Bauer, Paul W., Mark E. Schweitzer, and Scott Shane. 2006. “State Growth Empirics: The Long-Run Determinants of State Income Growth.” Federal Reserve Bank of Cleveland Working Paper 06-06. http://www.clevelandfed.org/research/workpaper/2006/wp0606.pdf
Bensi, Michelle, David Black, and Michael Dowd. 2004. “The Education/Growth Relationship: Evidence from Real State Panel Data.” Contemporary Economic Policy, vol. 22, no. 2. http://onlinelibrary.wiley.com/doi/10.1093/cep/byh020/abstract
Bureau of Economic Analysis. National Income and Product Accounts. Various years. National Income and Product Account Tables [data tables]. http://www.bea.gov/iTable/index_nipa.cfm
Bureau of Economic Analysis. State/National Income and Product Accounts public data series. Various years. Annual State Personal Income and Employment [data tables]. http://www.bea.gov/iTable/iTable.cfm?reqid=70&step=1&isuri=1&acrdn=1#reqid=70&step=1&isuri=1
Bureau of Labor Statistics. Current Population Survey Outgoing Rotation Group microdata. Various years. Survey conducted by the Bureau of the Census for the Bureau of Labor Statistics [machine-readable microdata file]. Washington, D.C.: U.S. Census Bureau. http://www.bls.census.gov/ftp/cps_ftp.html#cpsbasic
Bureau of Labor Statistics. Current Population Survey basic monthly microdata. Various years. Survey conducted by the Bureau of the Census for the Bureau of Labor Statistics [machine-readable microdata file]. Washington, D.C.: U.S. Census Bureau. http://www.bls.census.gov/ftp/cps_ftp.html#cpsbasic
Bureau of Labor Statistics. Labor Productivity and Costs program. Various years. Major Sector Productivity and Costs and Industry Productivity and Costs [databases]. http://bls.gov/lpc/#data (unpublished data provided by program staff at EPI’s request)
Bureau of Labor Statistics. Local Area Unemployment Statistics. Various years. http://www.bls.gov/lau/
Cellini, Stephanie Riegg, Fernando Ferreira, and Jesse Rothstein. 2010. “The Value of School Facility Investments: Evidence from a Dynamic Regression Discontinuity Design.” The Quarterly Journal of Economics, vol. 125, no. 1, 215–261. http://qje.oxfordjournals.org/content/125/1/215.short
Current Population Survey Annual Social and Economic Supplement. Historical Income Tables [data tables]. Various years. www.census.gov/hhes/www/income/data/historical/index.html
Duncan, Greg J., Ariel Kalil, and Kathleen Ziol-Guest. 2008. Economic Costs of Early Childhood Poverty. Washington, D.C.: Partnership for America’s Economic Success.
Fisher, Peter. 2013. Corporate Taxes and State Economic Growth. The Iowa Policy Project. http://www.iowafiscal.org/2011docs/110209-IFP-corptaxes.pdf
Fisher, Peter S., and Alan H. Peters. 1998. Industrial Incentives: Competition Among American States and Cities. W.E. Upjohn Institute for Employment Research, p. 5. http://www.upjohn.org/Publications/Titles/IndustrialIncentivesCompetitionAmongAmericanStatesandCities
French, Lily, and Peter S. Fisher. 2009. Education Pays in Iowa: The State’s Return on Investment in Workforce Education. The Iowa Policy Project. http://www.iowapolicyproject.org/2009docs/090528-ROI-educ.pdf
Grossman, Michael, and Robert Kaestner. 1997. “Effects of Education on Health” in The Social Benefits of Education, eds. J.R. Behrman and S. Nevzer. Ann Arbor: University of Michigan Press.
Haveman, Robert, and Barbara Wolfe. 1995. “The Determinants of Children’s Attainments: A Review of Methods and Findings.” Journal of Economic Literature, vol. 33, no. 4, 1829–1878.
Hirsch, Barry, and David Macpherson. Various years. Union Membership and Coverage Database. “All Wage & Salary Workers” [excel file]. http://www.unionstats.com/
Jacobson, Margaret, and Filippo Occhino. 2012. “Labor’s Declining Share of Income and Rising Inequality.” Economic Commentary, Federal Reserve Bank of Cleveland. http://www.clevelandfed.org/research/commentary/2012/2012-13.cfm
Knafo, Saki. 2012. “Smart Start? Will Preschool Budget Cuts Damage A Generation?” Huffington Post. http://www.huffingtonpost.com/2012/08/29/smart-start_n_1819501.html
Lleras-Muney, Adriana. 2005. “The Relationship Between Education and Adult Mortality in the United States” Review of Economic Studies, vol. 72, no. 1, 189–221.
Lochner, Lance, and Enrico Moretti. 2004. “The Effect of Education on Crime: Evidence from Prison Inmates, Arrests, and Self-Reports.” The American Economic Review, vol. 94, no. 1, 155–189.
Lynch, Robert. 2004. Rethinking Growth Strategies: How State and Local Taxes and Services Affect Economic Development. Washington, D.C.: Economic Policy Institute. http://www.epi.org/publication/books_rethinking_growth/
Lynch, Robert G. 2007. Enriching Children, Enriching the Nation: Public Investment in High-Quality Prekindergarten. Washington, D.C.: Economic Policy Institute. http://www.epi.org/publication/book_enriching/
Marr, Chuck, Jimmy Charite, and Chye-Ching Huang. 2013. Earned Income Tax Credit Promotes Work, Encourages Children’s Success at School, Research Finds. Center on Budget and Policy Priorities. http://www.cbpp.org/cms/?fa=view&id=3793
Mazerov, Michael. 2013. “Academic Research Lacks Consensus on the Impact of State Tax Cuts on Economic Growth: A Reply to the Tax Foundation.” Center on Budget and Policy Priorities, June 17. http://www.cbpp.org/files/6-17-13sfp.pdf
Mishel, Lawrence. 2012. “Understanding the Wedge Between Productivity and Median Compensation Growth.” Working Economics (the Economic Policy Institute blog). http://www.epi.org/blog/understanding-wedge-productivity-median-compensation/
Mishel, Lawrence, Josh Bivens, Elise Gould, and Heidi Shierholz. 2012. The State of Working America, 12th Edition. An Economic Policy Institute book. Ithaca, N.Y.: Cornell University Press.
Quinterno, John. 2012. The Great Cost Shift: How Higher Education Cuts Undermine the Future Middle Class. Demos. http://www.demos.org/publication/great-cost-shift-how-higher-education-cuts-undermine-future-middle-class
Smith, Judith R., Jeanne Brooks-Gunn, and Pamela K. Klebanov. 1997. “Consequences of Living in Poverty for Young Children’s Cognitive and Verbal Ability and Early School Achievement.” Pages 132–189 in Consequences of Growing up Poor, eds. G.J. Duncan and J. Brooks-Dunn. New York: Russell Sage Foundation.
Tax Policy Center. Various years. State Tax Facts [data tables]. http://www.taxpolicycenter.org/taxfacts/listdocs.cfm?topic2id=90
U.S. Census Bureau. Annual Survey of State Government Finances. Public data series. Various years. http://www.census.gov/govs/state/
Wolfe, Barbara, and Samuel Zuvekas. 1995. Nonmarket Outcomes of Schooling. University of Wisconsin, Institute for Research on Poverty, discussion paper no. 1065-95.
